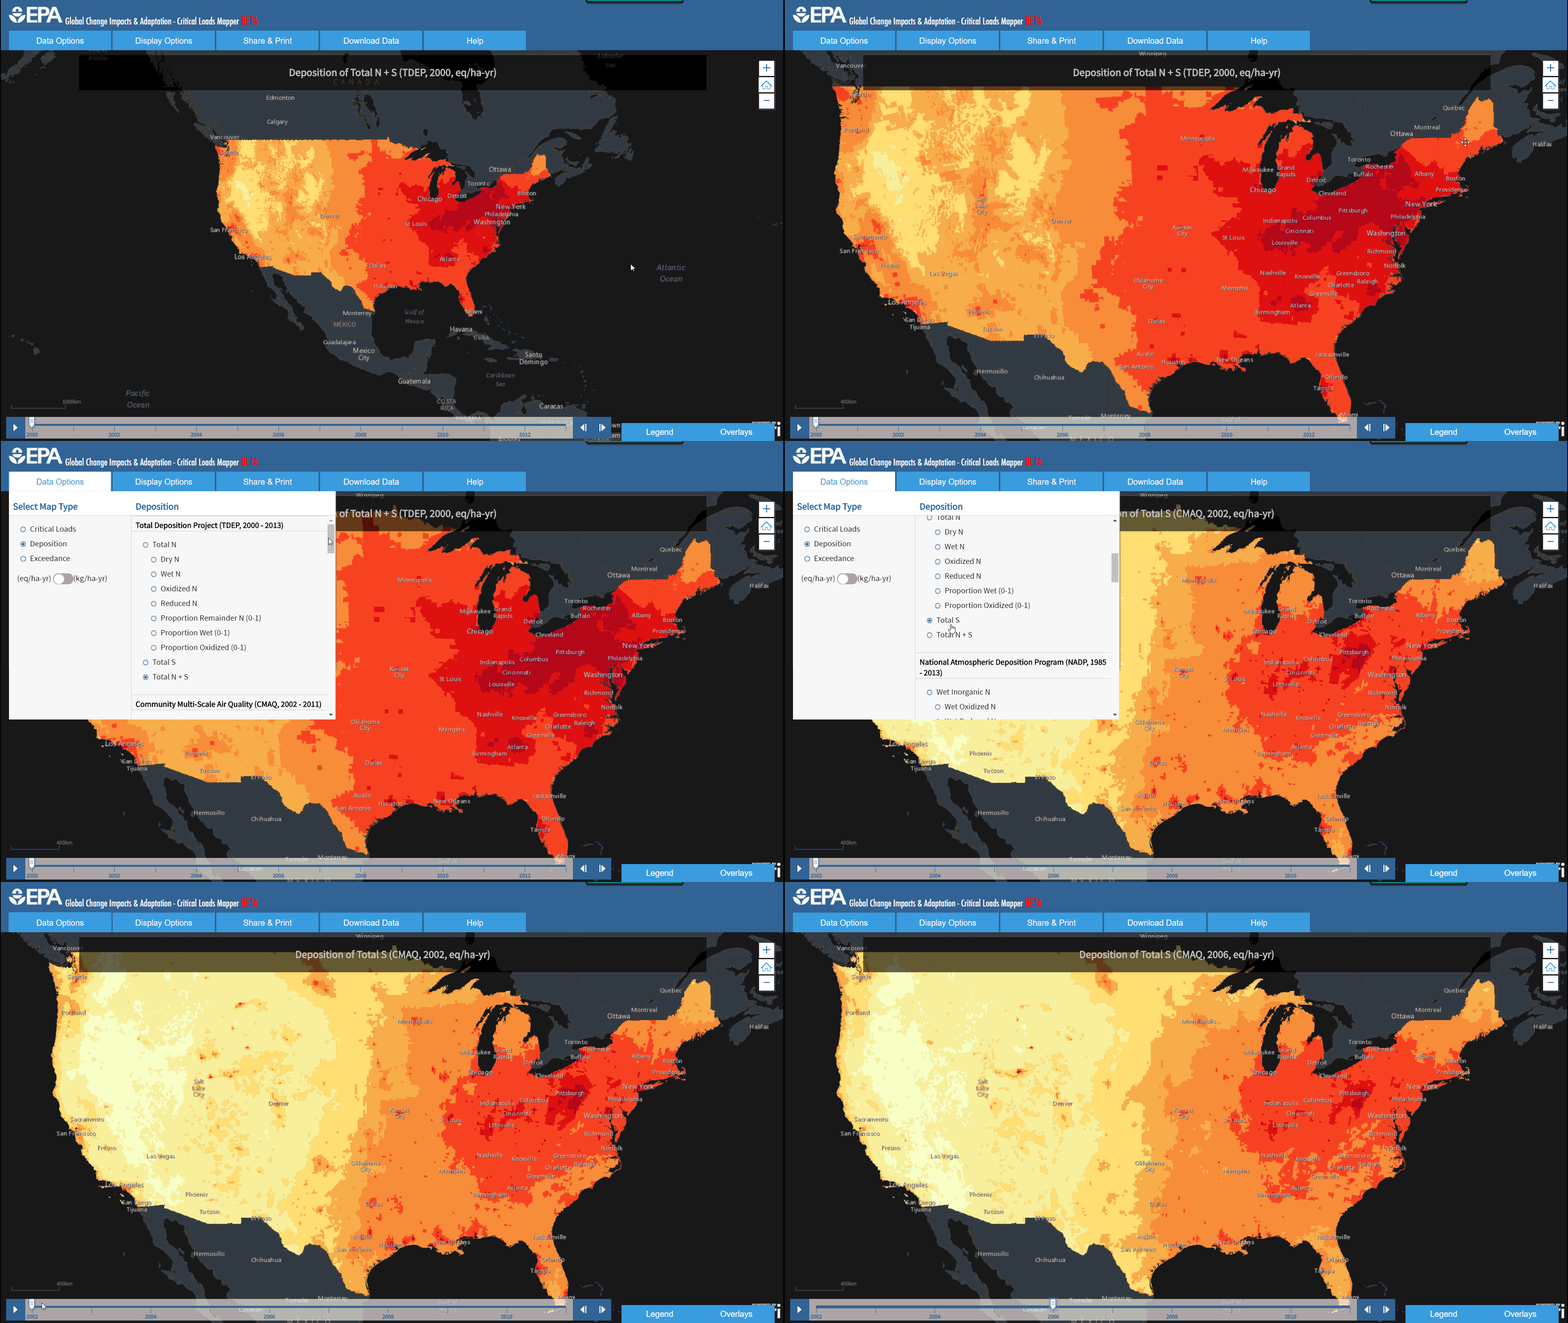
Blue Raster launches the Critical Loads Mapper for the Environmental Protection Agency, the latest tool in a collection of EPA’s Global-Change-Explorer platform. This interactive web application analyzes atmospheric deposition from Nitrogen and Sulfur. Despite abundance in atmosphere and aquatic ecosystems, an excess of Nitrogen can cause significant environmental and health issues, leading to economic impacts across communities. Sulfur, when compounded to form various Sulfur Oxides, can cause health and respiratory problems, damage foliage, and create haze. Working with EPA, Blue Raster created a consolidated source of information, allowing the study of these elements within our ecosystem across a variety of models and timelines.
EPA’s Critical Loads Mapper incorporates a collection of four different respected scientific research efforts, including the National Atmospheric Deposition Program (NADP), the Community Modeling and Analysis System (CMAQ), Total Deposition Science Committee (TDEP), and the Fifth Assessment Report (AR5) from the Intergovernmental Panel on Climate Change (IPCC). Each group of deposition estimates offers information on a variety of time spans, with some as early as 1851. Concentrations of these pollutants are predicted in deposition models which can help us better understand ecosystems at risk for exceedance of Nitrogen and Sulfur pollution.
In the application, you can overlay Federal lands and Wilderness areas from the Fish and Wildlife Service, National Park Service, and the US Forest Service. In our next release, users will be able to generate Deposition and Exceedance Profiles specific to each area.
With over 500 display options, the Critical Loads Mapper makes it easier for researchers, policy makers, and public officials to access this data, and create styled maps that can be saved, exported, or printed directly from the browser.
The Critical Loads Mapper is optimized to run at high performance, and leverages the ArcGIS Image Server for raster visualization and analysis. In addition, the application is built using Knockout, a JavaScript library that renders JSON (data) objects into html, for a simpler and more dynamic user interface experience. HTML5 Canvas, an html element, is the backbone for all of the on-the-fly printing capabilities. Each component of the application works to support the immense data being supplied while providing a user interface and user experience that is easily navigable and reliable.


