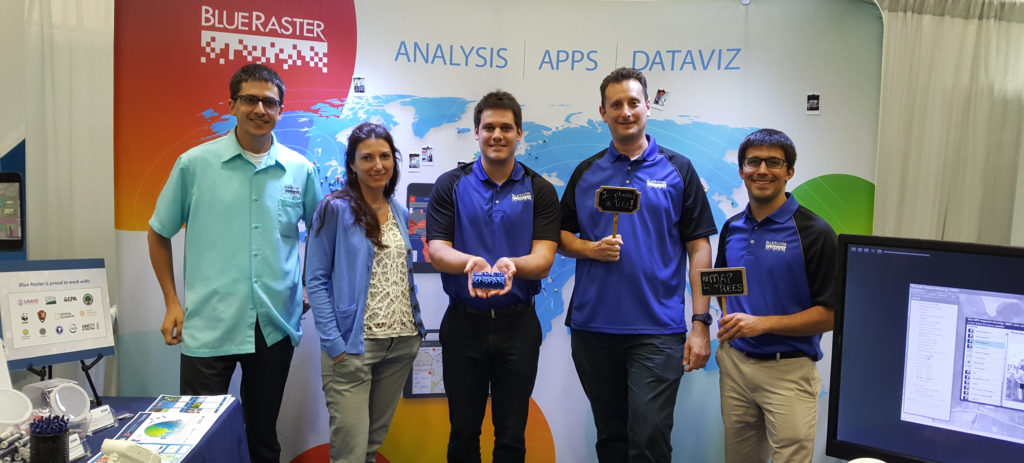
The Blue Raster team had a fantastic time at the 2016 Esri User Conference in San Diego earlier this month!
Highlights:
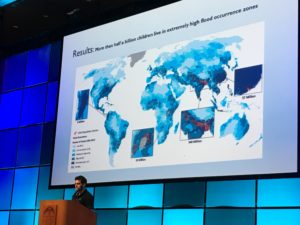
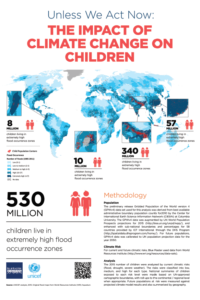
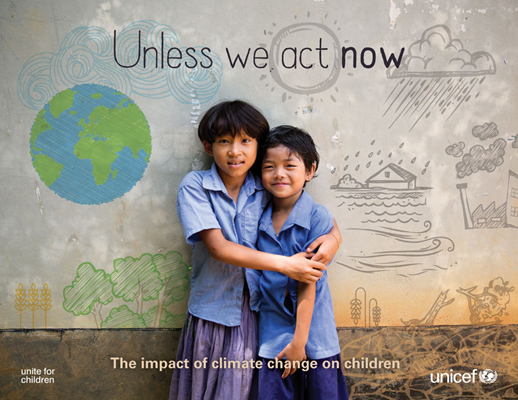
Chris’s lightning talk on UNICEF: Unless We Act Now
Blue Raster’s UNICEF Unless We Act Now poster was awarded in the ICA and IMIA Excellence in the Cartography category
Participation in the Small Business Walkthrough
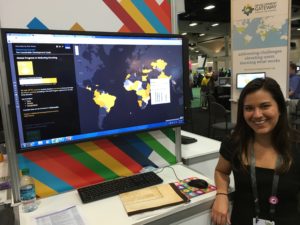
Christina’s presentation on the Sustainable Development Goals and The DHS Program
Adrienne’s panel presentation on Effective Geospatial Tools for Sustainable Development
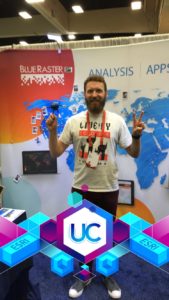
Our booth even received a visit from Globie and the Esri Snapchat team!
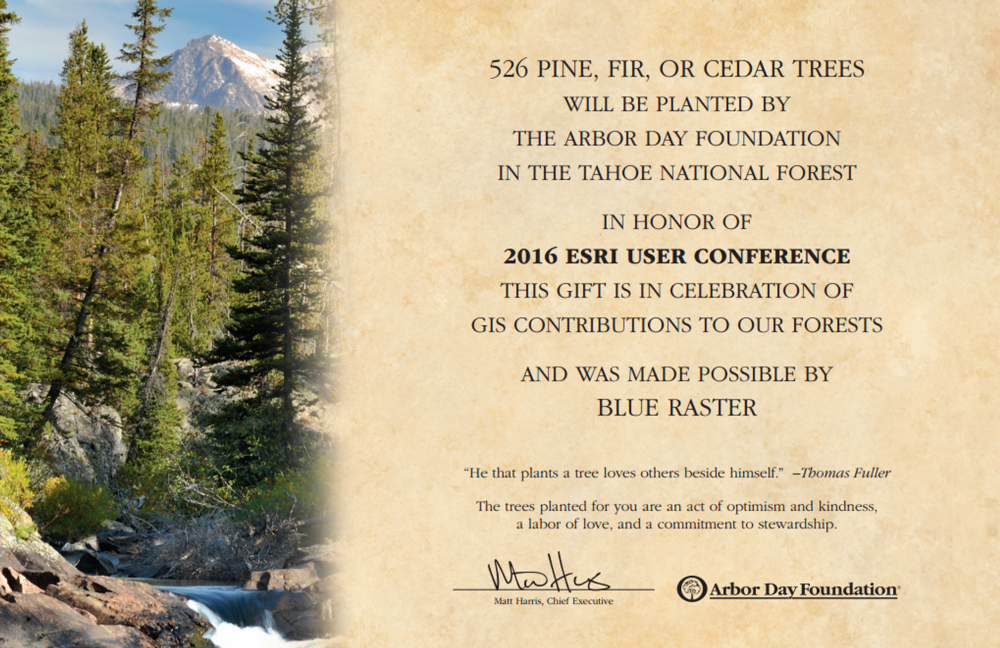
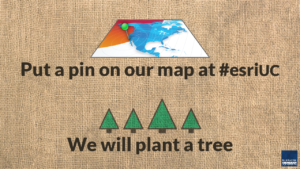
Our booth visits were more exciting this year because of our campaign to plant a tree for everyone that pinned our map. Blue Raster is very proud to sponsor 526 trees to be planted in Tahoe National Forest through the Arbor Day Foundation
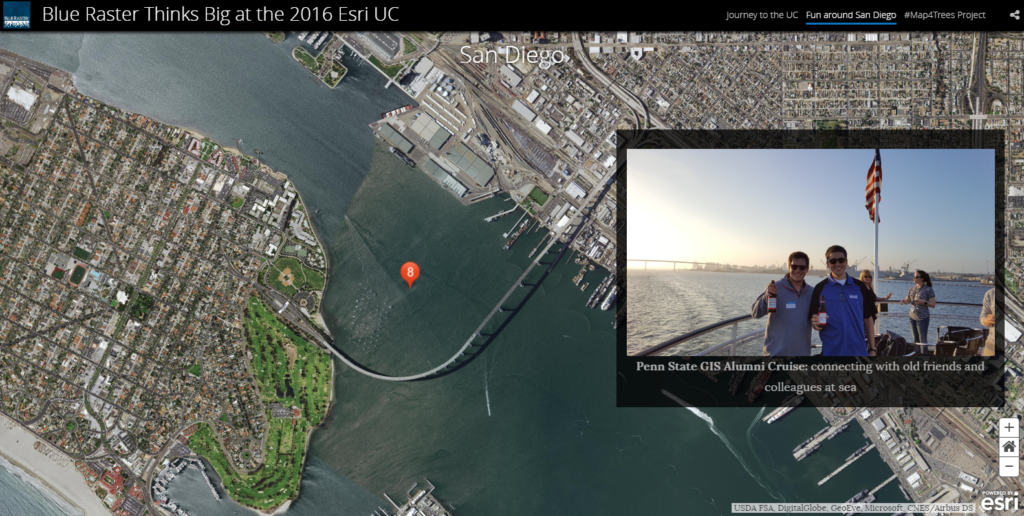
We had lots of fun using the new Story Map Cascade template to document our trip. Check out ourEsri UC 2016 Story Map for a closer look at our adventures and endeavors with the Arbor Day Foundation. Stay tuned for what we decide to do next year!
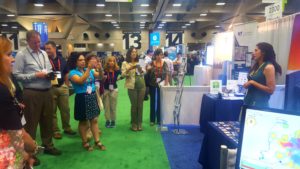
Blue Raster is proud to attend our 16th Esri User Conference in San Diego! This year we have teamed up with the National Arbor Day Foundation to replant our national forests. Place a pin on our map at #EsriUC, and we will plant a tree in Tahoe National Forest. Be sure to come check out Blue Raster at booth 2215, near the Sustainable World Showcase! Meet the Blue Raster team, learn about our mapping applications, plant a tree in Tahoe National Forest, and more!
Blue Raster events at Esri User Conference:
Monday
Impact of Climate Change on Children (UNICEF)
Monday (6/27) 4:30pm, Christopher Gabris
SDCC, Ballroom 20 D – Lightning Talk
Visit us in the Map Gallery to see our UNICEF poster
Monday (6/27) 3:30pm– 7:00pm, Map Gallery Opening and Evening Reception
SDCC, Sails Pavilion
Tuesday (World Resources Institute)
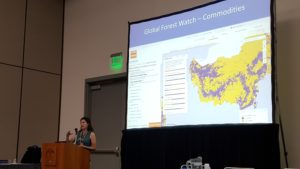
Using Big Data to Identify Patterns of Deforestation and Drive Action to Protect Forests (World Resources Institute) Tuesday (6/28) 2:30pm, Liz Goldman Conservation Tower
Mapping Sustainable Development Goals (DHS Program), Tuesday (6/28) 3:00pm, Christina Phang, Sustainable Development Tower (Exhibit Hall B1)
Community Forest Monitoring (Jane Goodall Institute)
Tuesday (6/28) 3:15pm
SDCC, Ballroom 24 C
Fish Taco Night in Ocean Beach
Tuesday (6/28) 7:00pm – Blue Raster’s annual retreat to Ocean Beach for the best fish tacos – Stop by the booth for details
Wednesday
Small Business Partners Walk through
Wednesday (7/29) 1:30pm
Panel Presentation – Effective Geospatial Tools for Sustainable Development
Wednesday (6/29) 3:15pm, Adrienne Allegretti Room 30A
Blue Raster is proud to announce a collaboration with The United Nations Children’s Fund (UNICEF) to contribute to Unless We Act Now: The Impact of Climate Change on Children – a report published by UNICEF at the annual Conference of Parties (COP21), also known as the 2015 Paris Climate Conference. COP21 is a renowned conference that brings together international voices representing government and UN Agencies, NGOs and civil society to assess climate change and set universal agreements and goals for reducing climate change and adapting to the changes that have already begun.
The Unless We Act Now report leveraged geospatial analysis of current demographic, environmental and projected climate data, in order to direct aid to child populations across the world as they face unforgiving changing weather patterns.
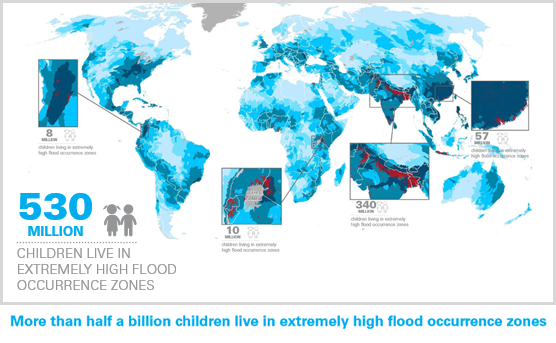
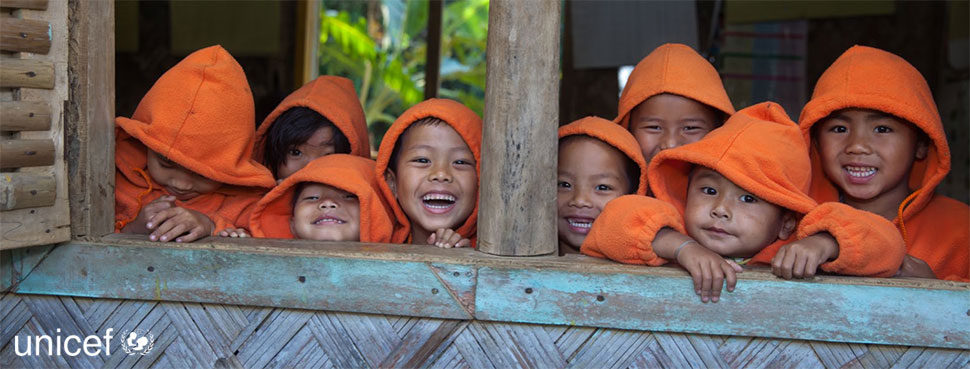
UNICEF has made putting children first their mission, and although climate change is an imminent threat to populations across the world, it is children who are hit the hardest as their bodies are most vulnerable to change. Being able to understand where these 2.3 billion children are was the first step, but taking this further to understand how environmental conditions such as droughts, floods, and extreme heat effect food and water supply, sanitation, and the spread of disease is made possible through GIS analysis via ArcGIS Desktop and ArcGIS Online.
Climate Change affects children in unique ways — these maps show where Children and Climate Change intersect.
“COP21 is a fantastic opportunity for UNICEF to present our “Unless We Act Now: The Impacts of Climate Change on Children” report, as climate change will be of critical importance when protecting and preserving the future livelihood of children around the world. Blue Raster was with us every step of the way during the data analysis and cartographic development, and their timely responses, adaptive and analytical methods, and personal connections to spatial data subject matter experts working around the world helped make this project a resounding success.”
– Nicholas Rees, Policy Analysis Specialist, UNICEF New York
A map poster featuring the analytical and cartographic work was then featured at the 2016 Esri User Conference and won the ICA and IMIA Excellence in Cartography award, and was selected for publication in 2017 Esri Map Book, Volume 32.
“The Impact of Climate Change on Children by UNICEF was recognized by the judges for it’s powerful, stark design on a relevant, topical subject. This work delivered a high impact, strong message with clarity and effective simplicity.”
– Esri Insider, July 14, 2016
A special thanks to:
Trevor Croft, DHS Program | Paul Reig and Tianyi Luo, World Resources Institute | Carmelle Terborgh, Esri
Deborah-Balk, The City University of New York | Susana Adamo and Kytt MacManus, CIESIN Columbia University
Blue Raster offers ArcGIS Accelerate solutions to help users quickly and easily tap into the power of this game-changing platform. We apply our extensive technical experience and comprehensive knowledge to help you configure, express, and share your data via accurate maps and innovative applications, cohesively through the fabric of ArcGIS Enterprise, ArcGIS Online, ArcGIS Pro, and ArcMap.
Blue Raster Can Get You There with ArcGIS Accelerate
We help clients establish themselves with ArcGIS technology to quickly and easily and help them understand the best practices of mapping and data management/standardization. We assess what organizations seek to do with their data and where they can benefit from ArcGIS services.
Through this process, you will be able to:
establish a geospatial program to share, analyze, and display your work
build your own applications for internal use or for sharing with others
leverage your GIS investment with a wide range of users and collaborators
offer access to your data and maps from anywhere by anyone you choose
create your own map layers from data you have in Excel
target your mapping work to benefit and inform specific groups and wider communities
We offer custom HTML5 programming for tailored applications and can integrate other visual media — photos and videos — from the platforms you already use. Through it all, we will be there to help you make your mapping work easy, fast, and impactful.
We Have the Experience You Need
Blue Raster is the expert in using ArcGIS Enterprise and ArcGIS Online to create and share maps fast. We are pros at helping you tell a visually rich and compelling story with your data and other media. Your data will help support this story in an approachable fashion.
We have transformed the way our customers share their stories using this powerful, secure cloud-based platform.
World Bank GeoResults
Blue Raster helped the World Bank establish its innovative GeoResults tool that documents, contextualizes, and graphically shares the on-the-ground results of its activities around the world. For the first time, projects are more than just dots on the map.
USAID Measure DHS Mobile
We worked with USAID to create the DHS Program mobile app, providing data on vaccination, childhood mortality, nutrition, and 22 other indicators to users in more than 90 countries. In much of the world, mobile devices outnumber traditional desktops in terms of how users consume information.
IUCN Red List Mapper
We collaborated with the International Union for Conservation of Nature (IUCN) to create the IUCN Red List Mapper, sharing the story behind threatened species and protected areas around the world. IUCN is the international authority on animal ranges, and the Cloud offerings of ArcGIS Online made it possible to share incredibly large volumes of data.
What Can We Help You Create with ArcGIS Online?
Teaming up with Blue Raster and ArcGIS technology will help you capitalize on the inherent value of your data and information. Dynamically develop and express the stories you want to share with our quick and hassle-free approach. To learn more about the ArcGIS Accelerate program, call us at (703) 875-0911 or submit the form below:
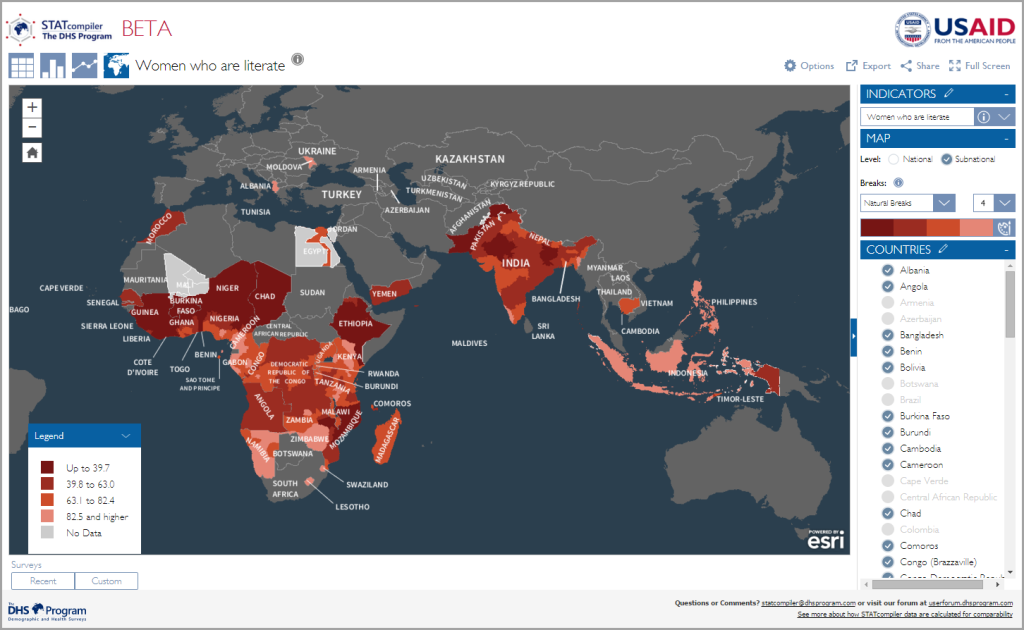
More than 15 years after initial creation, STATCompiler has reached a level of unparalleled excellency with the latest release. The newly designed Beta STATCompiler website now reflects the most up-to-date indicator data from The DHS Program in a platform accessible universally across devices.
There are several changes to STATCompiler that bring it in to a new era:
New user interface and all new cartography for beautiful maps and visualizations
Over 500 new indicators including data from the DHS-6 tabulation plan on topics such as domestic violence, female genital cutting, malaria and maternal mortality
Metadata is now included in the “indicator details” with full definitions, denominators, and the measure of data (rate, percentage, etc.).
Confidence Intervals are now included in the graphics, an especially important consideration for rare events, particularly HIV prevalence and maternal mortality.
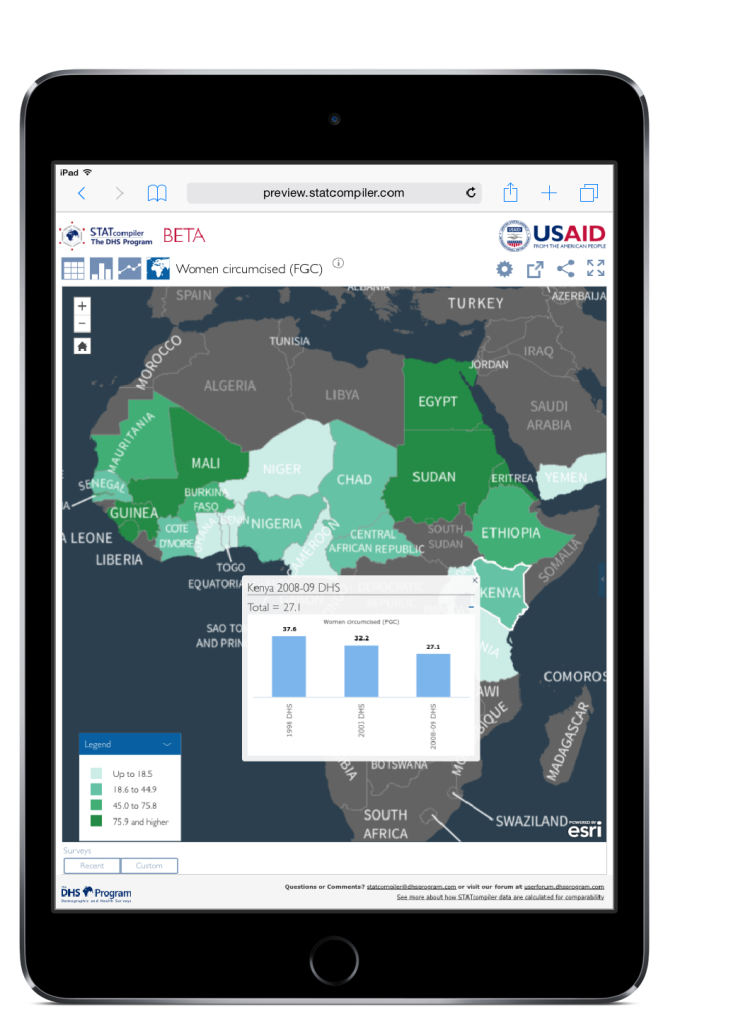
New data visualizations such as pop-ups in the map that summarizes trends over time
Mobile friendly interface allows it to be accessed on tablet devices.
The site now leverages the DHS Program’s public Application Programming Interface (API) ensuring data continuity and authenticity.
STATCompiler is built with modern tools such as JavaScript, HTML 5, the ArcGIS JavaScript API and incorporates proven legacy tools such as ColdFusion.


 Blue Raster helped the World Bank establish its innovative
 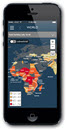 We worked with USAID to create the
  We collaborated with the International Union for Conservation of Nature (IUCN) to create the